
Reporting demonstration · In-house demonstration
Business Operations Dashboard
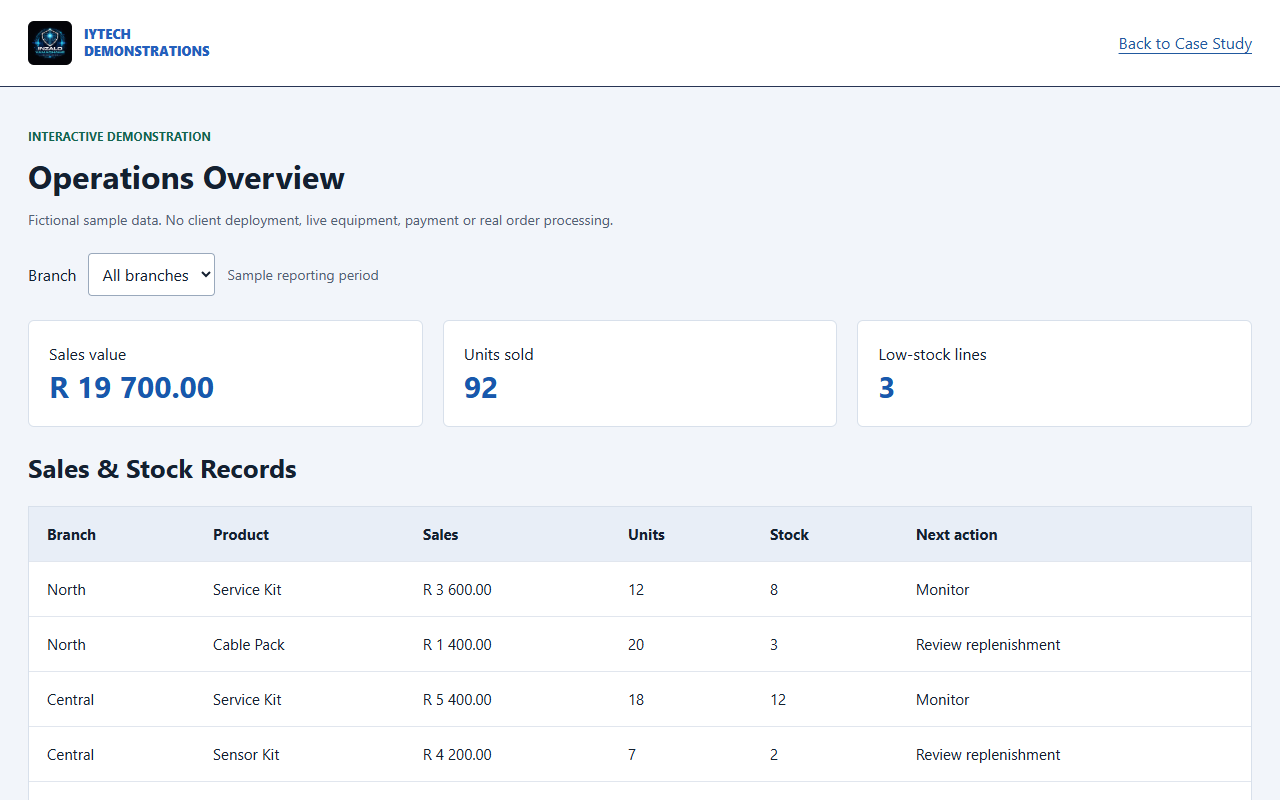
An interactive sample dashboard with branch filtering, calculated totals and an operational records table.
The Business Problem
A team needs a quick way to compare sales, stock status and follow-up priorities across locations.
The Demonstration
Switch the branch filter and inspect the changing totals. All names, figures and records are fictional sample data, not company or client results.
Open Interactive DemoTechnology & Production Scope
HTML, CSS and JavaScript with a local sample dataset. Live SQL/API connections, roles and audit history require a production scope.
What This Shows
This example demonstrates an interface and workflow. It does not establish a client deployment, sales uplift, production reliability, security certification or a final project price.